I'm done now with the first week of the Spring quarter. It was a bit challenging because I had to attend the PAA meetings in Washington, DC for the latter part of the week, but Brian Wood ably covered for me on Thursday. I thought that I would use the blog as a tool for summarizing one of the key points I want students to take away from this fist week in which we discussed evolution and natural selection.
We spent a good deal of lecture time talking about adaptation. Specifically, we discussed how adaptation can serve as a foil to typology and essentialism. Adaptation is local and must be seen within its specific environmental and historical context. Adaptations are dynamic because environments are.
Adaptationist thinking is powerful, but can easily be overdone. This is why I also think it is essential to understand the mechanics of selection, something that I'm afraid is not often addressed in introductory evolutionary anthropology classes. So, in the very first lecture of class, I throw some quantitative genetics (and, thus, some math) at students. Of course, these are Stanford students, so I'm confident they can handle a little techie-ness every now and then. We specifically discuss the multivariate breeder's equation, sometimes known as Lande's equation:

where  is the change in the mean fitness of a multivariate trait,
  is the additive genetic variance-covariance matrix, and
  is the selection gradient on
  .
.
In effect, is a vector pointing in the direction of the optimal change in the phenotype. The matrix does two things to this gradient pushing toward its optimum: (1) it scales the response depending on how much additive variance there is in each trait and (2) it rotates it as a function of the covariances between traits. I won't get too much into matrix multiplication here (this is a very nice reference too). The key point is that is a square  matrix (where
  is the number of traits we're looking at) the diagonal elements of which are variances and the off-diagonal elements of which,
  represent the covariances between traits
  and
and  . Selection requires variance. Without sufficient variance, even strong selection won't change the phenotype much between generations. But variance isn't all there is to it. When the covariances are positive, there will be substantial indirect selection, and when they are negative, you have genetic constraints at work. Selection may be pointing in a particular direction, but the structure of the trade-offs could very easily mean that you can't actually get there.
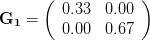
Let's consider three quick (toy) examples. Say we have two traits, maybe "length" and "width" (this could be something less vague and insipid: Lande (1979) looks at brain mass and body mass in a serious two-trait example). We will assume that the selection gradient is  . That is, the force of selection is twice as high on length as it is on width, but it is pretty strong and positive on both. We'll demonstrate the effect of variance and constraint in three ways: (1) more variance in the trait under weaker selection (
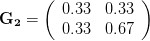
 ), (2) positive covariance between the two traits (
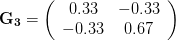
 ), and (3) negative covariance between the two traits (
 ).
).
The figure below plots the response to selection in the three different types of genetic architecture. The direction of selection is indicated in the grey arrow. If the variances of the two traits were equal to 1 and there were zero covariances, this is where selection would move the phenotype pair (try it). We can see that the response to selection moves toward width (the trait under weaker selection) even when covariances are zero (black arrow). Why? Because there is more variance for width than there is for length ( ). This effect becomes more pronounced when there is positive covariance between the traits (blue arrow) -- the selection toward width is
  . When the covariances are negative, we see something cool (red arrow). The response to selection is small and moves (almost) entirely in the direction of length. This is because the negative covariance between length and width, when acted on by the strong selection on length, all but cancels out the positive response to selection (
 ).
).

This simple demonstration shows that the response to selection can be complex. Making an argument that some trait would be under selection is not sufficient to say that it actually evolved (or will evolve) that way. Entirely plausible arguments for the direction of selection are made all the time in evolutionary anthropology. Here is one from a very important paper in paleoanthropology (Lovejoy 1981: 344):
Any behavioral change that increases reproductive rate, survivorship, or both, is under selection of maximum intensity. Higher primates rely on social behavioral mechanisms to promote survivorship during all phases of the life cycle, and one could cite numerous methods by which it theoretically could be increased. Avoidance of dietary toxins, use of more reliable food sources, and increased competence in arboreal locomotion are obvious examples. Yet these are among the many that have remained under stadong selection throughout much of the course of primate evolution, and therefore unlikely that early hominid adaptation was a product of intensified selection for adaptations almost universal to anthropoid primates.
Arguing for selection without considering trade-offs can get you into trouble. Selection in the presence of quantitative genetic constraints (or even differential variance in the traits) can produce counter-intuitive results. (Selectionists, don't dispair. There are ways to deal with this, but it will have to wait for another post). In the case of Lovejoy's argument, there are good reasons to think that survivorship and reproductive rate are, indeed, strongly negatively correlated. Which is under stronger selection? Which has more additive variance? How strong are the negative covariances?
When we make selectionist or adaptationist arguments, we should always keep in the back of our minds the three questions:
- How strong is the force of selection?
- How much variance is there on which selection can act?
- How is the trait constrained through negative correlations with other traits?
References
Lande, R. A. 1979. Quantitative genetic analysis of multivariate evolution applied to brain: body size evolution. Evolution. 33:402-416.
Lovejoy, C. O. 1981. The origin of man. Science. 211:341-350.