Category Archives: R

Quick and Dirty Analysis of Ebola

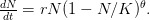
I've been traveling all summer while this largest Ebola Virus Disease (EVD) outbreak in recorded history has raged in the West African countries of Guinea, Sierra Leone, Liberia, and (worryingly) Nigeria. My peripatetic state has meant that I haven't been able to devote as much attention to this outbreak as I would like to. There is a great deal of concern -- some might say hysteria -- about EVD and the possibility that it may go pandemic. Tara Smith at least, on her Aetiology blog, has written something sensible, noting that EVD, while terrifying, is controllable with careful public health protective measures, as the historical record from Uganda shows. A recent post by Greg Laden got me to thinking about the numbers from the current EVD outbreak and what we might be able to learn.

EVD was the model disease for the terrible (1995) Dustin Hoffman movie, Outbreak. As we learned in the much more scientifically-accurate (2011) movie Contagion (which is based on an equally terrifying aerosolized Nipah virus), one of the key pieces of information regarding an epidemic is the basic reproduction number, R_0. The basic reproduction number tells us how many secondary infections are expected (i.e., on average) to be produced by a single, typical case at the outset of an epidemic before the pool of susceptible people has been depleted.  R_0 provides lots of information about epidemics, including: (1) the epidemic threshold (i.e., whether or not an epidemic will occur, which happens in the deterministic case when R_0 > 1), (2) the initial rate of increase of an epidemic, (3) the critical vaccination threshold (i.e., what fraction of the population you need to vaccinate to prevent an outbreak), (4) the endemic equilibrium of an infection (i.e., the fraction of the population that is infected in between outbreaks), and (5) the final size of the epidemic (i.e., the fraction of the total population that is ever infected when the epidemic is over).

Thus, for a novel outbreak, it's good to have an idea of R_0. I've been a bit out of the loop this summer and haven't seen any estimates so I figured that I would see what I could do. I fully realize that someone may have already done this and that I am not yet aware of it. I also recognize that, if someone has done this, they've probably done it better. This is a blog, not a peer-reviewed paper, and I am away from my usual resources, so please take this in the back-of-the-envelope spirit in which it is intended. I reserve the right to retract, etc. I will also post the R code that I used to make the calculations. I hope that this may prove helpful to others interested in the dynamics of outbreaks.

In their terrific (2003) paper on the SARS outbreak, Marc Lipsitch and colleagues provided a method for estimating the reproduction number from outbreak data. Note that this is a more generalized reproduction number, which we call R, than is the basic reproduction number, R_0. The key difference is that a reproduction number can be calculated at any point in an outbreak, whereas R_0 is only technically correct at the outset (the zero index in R_0 indicates the "generation" of the outbreak where "0" refers to the index case, a.k.a., "patient zero"). I've simply used the count of total cases from this week. It is straightforward to extend the calculation to previous counts. I haven't yet had a chance to do this because there is no convenient collection of data that I can find with my current access constraints.

The method involves equating R_0 for a simplified SEIR system to the observed rate of increase of the outbreak at some point in time t, using the fact that the reproduction number is approximately equivalent to the growth rate of the epidemic. See the supplementary information from Lipsitch et al. (2003) for details of the method. In brief, we calculate the dominant eigenvalue of the linearized SEIR model, for which it is straightforward to write an analytical formula, and equate this to log[Y(t)]/t, the empirical growth rate of the epidemic (where Y(t) is the cumulative number of cases at time t). Lipsitch et al. (2003) note that using the standard formula for the characteristic equation of the eigenvalues of the linearized SEIR model, we can solve for the reproduction number as:

 R = 1 + V \lambda + f(1-f) (V \lambda)^2,

where V is the serial interval (i.e., the summed duration of the incubation period, L, and the duration of the infectious period, D), \lambda is the positive root of the characteristic equation which we set equal to \log[Y(t)]/t, and f is the ratio of the infectious period of the serial interval.

I got the case data from the weekly WHO outbreak report for 11 August 2014. For this week Y(t)=1848. For the start time of the epidemic in the currently afflicted countries, I used the date of 10 March 2014, taken from this week's NEJM paper by Blaize et al. (2014). For the serial interval data, I used the values provided by the Legrand et al. (2007). Because Legrand et al. (2007) provide mean values of the relevant parameters -- and this is a different epidemic -- I used a variety of values for D and L to calculate R. It turns out that it doesn't matter all that much; the estimates of R are pretty stable.

I plot the values of R against the duration of the latent period. The different lines are for the different values of the duration of infectiousness. R increases with both. What we see is that at this point in the epidemic at least, R ranges from around 1.3 to 2.6, depending on specifics of the course of the disease. This is not all that high -- about the same as various flavors of influenza and considerably less than, say, pertussis. This is good news for potential control, if we could just rally some more international support for control of this serious infection...

Ebola-R0-plot1


Here is the R code for doing the calculations and creating this figure:

[r]

library(lubridate)
# number of cases as of 11 August 2014
# http://www.who.int/csr/don/2014_08_11_ebola/en/
cases <- 1848 # start of epidemic in Guinea: 10 March 2014 # Blaize et al. (2014), NEJM. DOI: 10.1056/NEJMoa1404505 s <- dmy("10-03-14") e <- dmy("11-08-14") t <- e-s # Time difference of 154 days ## incubation period 2-21 days ## http://www.who.int/mediacentre/factsheets/fs103/en/ ## duration of infectiousness: virus detected in of lab-infected man 61 days! ## Legrande et al. (2007) use L=7 and D=10 ## doi:10.1017/S0950268806007217 lambda <- log(cases)/t ## From Lipsitch et al. (2003) ## lambda is the dominant eigenvalue of the linearized SEIR model ## V is the serial interval V = D + L ## D is duration infectious period, L is duration of latent period ## f is the ratio of the the infectious period to the serial interval ## to solve for R set the eigenvalue equal to the observed exponential growth rate of the epidemic log(Y(t))/t Rapprox <- function(lambda,V,f) 1 + V*lambda + f*(1-f)*(V* lambda)^2 RR <- matrix(0, nr=10, nc=10) L <- seq(3,12) D <- seq(5,14) for(i in 1:length(L)){ for(j in 1:length(D)){ RR[i,j] <- Rapprox(lambda,L[i]+D[j],D[j]/(L[i]+D[j])) } } cols <- topo.colors(10) png(file="Ebola-R0-plot1.png") plot(L, RR[1,], type="n", xlab="Duration of Incubation", ylab="Reproduction Number",ylim=c(1,2.5)) for(i in 1:10) lines(L, RR[i,], lwd=2, col=cols[i]) dev.off() [/r]

Plotting Error Bars in R

One common frustration that I have heard expressed about R is that there is no automatic way to plot error bars (whiskers really) on bar plots.  I just encountered this issue revising a paper for submission and figured I'd share my code.  The following simple function will plot reasonable error bars on a bar plot.

[r]
error.bar <- function(x, y, upper, lower=upper, length=0.1,...){ if(length(x) != length(y) | length(y) !=length(lower) | length(lower) != length(upper)) stop("vectors must be same length") arrows(x,y+upper, x, y-lower, angle=90, code=3, length=length, ...) } [/r] Now let's use it.  First, I'll create 5 means drawn from a Gaussian random variable with unit mean and variance.  I want to point out another mild annoyance with the way that R handles bar plots, and how to fix it.  By default, barplot() suppresses the X-axis.  Not sure why.  If you want the axis to show up with the same line style as the Y-axis, include the argument axis.lty=1, as below. By creating an object to hold your bar plot, you capture the midpoints of the bars along the abscissa that can later be used to plot the error bars. [r] y <- rnorm(500, mean=1) y <- matrix(y,100,5) y.means <- apply(y,2,mean) y.sd <- apply(y,2,sd) barx <- barplot(y.means, names.arg=1:5,ylim=c(0,1.5), col="blue", axis.lty=1, xlab="Replicates", ylab="Value (arbitrary units)") error.bar(barx,y.means, 1.96*y.sd/10) [/r] error-bars
Now let's say we want to create the very common plot in reporting the results of scientific experiments: adjacent bars representing the treatment and the control with 95% confidence intervals on the estimates of the means.  The trick here is to create a 2 x n matrix of your bar values, where each row holds the values to be compared (e.g., treatment vs. control, male vs. female, etc.). Let's look at our same Gaussian means but now compare them to a Gaussian r.v. with mean 1.1 and unit variance.

[r]
y1 <- rnorm(500, mean=1.1) y1 <- matrix(y1,100,5) y1.means <- apply(y1,2,mean) y1.sd <- apply(y1,2,sd) yy <- matrix(c(y.means,y1.means),2,5,byrow=TRUE) ee <- matrix(c(y.sd,y1.sd),2,5,byrow=TRUE)*1.96/10 barx <- barplot(yy, beside=TRUE,col=c("blue","magenta"), ylim=c(0,1.5), names.arg=1:5, axis.lty=1, xlab="Replicates", ylab="Value (arbitrary units)") error.bar(barx,yy,ee) [/r] means-comparison

Clearly, a sample size of 100 is too small to show that the means are significantly different. The effect size is very small for the variability in these r.v.'s.  Try 10000.

[r]
y <- rnorm(50000, mean=1) y <- matrix(y,10000,5) y.means <- apply(y,2,mean) y.sd <- apply(y,2,sd) y1 <- rnorm(50000, mean=1.1) y1 <- matrix(y1,10000,5) y1.means <- apply(y1,2,mean) y1.sd <- apply(y1,2,sd) yy <- matrix(c(y.means,y1.means),2,5,byrow=TRUE) ee <- matrix(c(y.sd,y1.sd),2,5,byrow=TRUE)*1.96/sqrt(10000) barx <- barplot(yy, beside=TRUE,col=c("blue","magenta"), ylim=c(0,1.5), names.arg=1:5, axis.lty=1, xlab="Replicates", ylab="Value (arbitrary units)") error.bar(barx,yy,ee) [/r] means-comparison1

That works. Maybe I'll show some code for doing power calculations next time...

Why Use R?

An anthropologist colleague who did a post-doc in a population center has been trying to get a group of people at his university together to think about population issues.  This is something I'm all for and am happy to help in whatever little way I can to facilitate especially anthropologists developing their expertise in demography.  One of the activities they have planned for this population interest group is a workshop on the R statistical programming language. The other day he wrote me with the following very reasonable question that has been put to him by several of the people in his group: Sure R is free but other than that why should someone bother to learn new software when there is perfectly acceptable commercial software out there?  This question is particularly relevant when one works for an institution like a university where there are typically site licenses and other mechanisms for subsidizing the expense of commercial software (which can be substantial).  What follows is, more or less, what I said to him.

I should start out by saying that there is a lot to be said for free. I pay several hundred dollars a year for commercial software that I don't actually use that often. Now, when I need it, it's certainly nice to know it's there but if I didn't have a research account paying for this software, I might let at least one or two of these licenses slide.  I very occasionally use Stata because the R package that does generalized linear mixed models has had a bug in the routine that fits logistic mixed models and this is something that Stata does quite well. So I regularly get mailings about updates and I am always just blown away at the expense involved in maintaining the most current version of this software, particularly when you used the intercooled version.  It's relatively frequently updated (a good thing) but these updates are expensive (a bad thing for people without generous institutional subsidies). So, let me just start by saying that free is good.

This actually brings up a bit of a pet peeve of mine regarding training in US population centers.  We have these generous programs to train population scientists and policy-makers from the poor countries of the world.  We bring them into our American universities and train them in demographic and statistical methods on machines run by proprietary (and expensive!) operating systems and using extremely expensive proprietary software.  These future leaders will graduate and go back home to Africa, Asia, eastern Europe, or Latin America. There, they probably won't have access to computers with the latest hardware running the most recent software.  Most of their institutions can't afford expensive site licenses to the software that was on every lab machine back at Princeton or UCLA or Michigan or [fill in your school's name here]. This makes it all the more challenging to do the work that they were trained to do and leaves them just that much more behind scholars in advanced industrial nations.  If our population centers had labs with computers running Linux, taught statistics and numerical methods using R, and had students write LaTeX papers, lecture slides, and meeting posters using, say, Emacs rather than some bloated word-processor whose menu structure seems to change every release, then I think we would be doing a real service to the future population leaders of the developing world. But let's return to the question at hand, other than the fact that it's free -- which isn't such an issue for someone with a funded lab at an American University -- why should anyone take the trouble to learn R? I can think of seven reasons off the top of my head.

(1) R is what is used by the majority of academic statisticians.  This is where new developments are going to be implemented and, perhaps more importantly, when you seek help from a statistician or collaborate with one, you are in a much better position to benefit from the interaction if you share a common language.

(2) R is effectively platform independent.  If you live in an all-windows environment, this may not be such a big deal but for those of us who use Linux/Mac and work with people who use windows, it's a tremendous advantage.

(3) R has unrivaled help resources.  There is absolutely nothing like it.  First, the single best statistics book ever is written for R (Venables & Ripley, Modern Applied Statistics in S -- remember R is a dialect of S).  Second, there are all the many online help resources both from r-project.org and from many specific lists and interest groups. Third, there are proliferating publications of excellent quality. For example, there is the new Use R series. The quantity and quality of help resources is not even close to matched by any other statistics application.  Part of the nature of R -- community constructed, free software -- means that the developers and power users are going to be more willing to provide help through lists, etc. than someone in a commercial software company. The quality and quantity of help for R is particularly relevant when one is trying to teach oneself a new technique of statistical method.

(4) R makes the best graphics. Full stop. I use R, Matlab, and Mathematica.  The latter two applications have a well-deserved reputation for making great graphics, but I think that R is best.  I quite regularly will do a calculation in Matlab and export the results to R to make the figure.  The level of fine control, the intuitiveness of the command syntax (cf. Matlab!), and the general quality of drivers, etc. make R the hands-down best.  And let's face it, cool graphics sell papers to reviewers, editors, etc.

(5) The command-line interface -- perhaps counterintuitively -- is much, much better for teaching.  You can post your code exactly and students can reproduce your work exactly.  Learning then comes from tinkering. Now, both Stata and SAS allow for doing everything from the command line with scripts like do-files.  But how many people really do that?  And SPSS...

(6) R is more than a statistics application.  It is a full programming language. It is designed to seamlessly incorporate compiled code (like C or Fortran) which gives you all the benefits of a interactive language while allowing you to capitalize on the speed of compiled code.

(7) The online distribution system beats anything out there.

Oh, and let's face it, all the cool kids use it...

Platform for Developing Mathematical Models of Infectious Disease

Every once in a while someone asks me for advice on the platform to use for developing models of infectious disease.  I typically make the same recommendations -- unless the person asking has something very specific in mind. This happened again today and I figured I would turn it into a blog post.

The answer depends largely on (1) what types of models you want to run, (2) how comfortable you are with programming, and (3) what local resources (or lack thereof) you might have to help you when you inevitably get stuck.  If you are not comfortable with programming and you want to stick to fairly basic compartmental models, then something like Stella or Berkeley Madonna would work just fine.  There are a few books that provide guidance on developing models in these systems.  I have a book by Hannon and Ruth that is ten years old now but, if memory serves me correctly, was a pretty good introduction both to STELLA and to ecological modeling. They have a slightly newer book as well.  Models created in both systems appear in the primary scientific literature, which is always a good sign for the (scientific) utility of a piece of software.  These graphical systems lack a great deal of flexibility and I personally find them cumbersome to use, but they match the cognitive style of many people quite nicely, I think, and probably serve as an excellent introduction to mathematical modeling.

Moving on to more powerful, general-purpose numerical software...

Based on my unscientific convenience sample, I'd say that most mathematical epidemiologists use Maple.  Maple is extremely powerful software for doing symbolic calculations.  I've tried Maple a few times but for whatever reason, it never clicked for me.  Because I am mostly self-taught, the big obstacle for me using Maple has always been the lack of resources either print or internet for doing ecological/epidemiological models in this system. Evolutionary anthropologist Alan Rogers does have some excellent notes for doing population biology in Maple.

Mathematica has lots of advantages but, for the beginner, I think these are heavily outweighed by the start-ups costs (in terms of learning curve). I use Mathematica some and even took one of their courses (which was excellent if a little pricey), but I do think that Mathematica handles dynamic models in a rather clunky way. Linear algebra is worse.  I would like Mathematica more if the notebook interface didn't seem so much like Microsoft Word.  Other platforms (see below) either allow Emacs key bindings or can even be run through Emacs (this is not a great selling point for everyone, I realize, but given the likely audience for Mathematica, I have always been surprised by the interface). The real power of Mathematica comes from symbolic computation and some of the very neat and eclectic programming tools that are part of the Mathematica system. I suspect I will use Mathematica more as time goes on.

Matlab, for those comfortable with a degree of procedural-style programming, is probably the easiest platform to use to get into modeling. Again, based on my unscientific convenience sample, my sense is that most quantitative population biologists and demographers use Matlab. There are some excellent resources.  For infectious disease modeling in particular, Keeling and Rohani have a relatively new book that contains extensive Matlab code. In population biology, books by Caswell and Morris and Doak, both contain extensive Matlab code.  Matlab's routines for linear algebra and solving systems of differential equations are highly optimized so code is typically pretty fast and these calculations are relatively simple to perform.  There is a option in the preferences that allows you to set Emacs key bindings.  In fact, there is code that allows you to run Matlab from Emacs as a minor mode.  Matlab is notably bad at dealing with actual data.  For instance, you can't mix and match data types in a data frame (spreadsheet-like structure) very easily and forget about labeling columns of a data frame or rows and columns of a matrix. While its matrix capabilities are unrivaled, there is surprisingly little development of network models, a real growth area in infectious disease modeling. It would be really nice to have some capabilities in Matlab to import and export various network formats, thereby leveraging Matlab's terrific implementation of sparse matrix methods.

Perhaps not surprisingly, the best general tool, I think, is R.  This is where the best network tools can be found (outside of pure Java). R packages for dealing with social networks include the statnet suite (sna, network, ergm), igraph, graphblockmodeling, RGBL, etc. (the list goes on).  It handles compartmental models in a manner similar to Matlab using the deSolve package, though I think Matlab is generally a little easier for this.  One of the great things about R is that it makes it very easy to incorporate C or Fortran code. Keeling and Rohani's book also contains C++ and Fortran code for running their models (and such code is generally often available).  R and Matlab are about equally easy/difficult (depending on how you see it) to learn.  Matlab is somewhat better with numerically solving systems of differential equations and R is much better at dealing with data and modeling networks.  R can be run through Emacs using ESS (Emacs Speaks Statistics).  This gives you all the text-editing benefits of a state-of-the-art text editor plus an effectively unlimited buffer size.  It can be very frustrating indeed to lose your early commands in a Matlab session only to realize that you forgot to turn on the diary function. No such worries when your run R through Emacs using ESS.

One of the greatest benefits of R is its massive online (and, increasingly, print publishing) help community. I think that this is how R really trumps all the other platforms to be the obvious choice for the autodidacts out there.

I moved from doing nearly all my work in Matlab to doing most work in R, with some in Mathematica and a little still in Matlab.  These are all amazingly powerful tools.  Ultimately, it's really a matter of taste and the availability of help resources that push people to use one particular tool as much as anything else.  This whole discussion has been predicated on the notion that one wants to use numerical software.  There are, of course, compelling reasons to use totally general programming tools like C, Java, or Python, but this route is definitely not for everyone, even among those who are interested in developing mathematical models.

Exporting Deviance Tables to (ugh) Word

I do my absolute best to minimize the amount of time Word is open on my computer desktop.  Alas, when one collaborates widely, particularly with non-technical people, it is a necessary evil.

In these collaborations, I am typically doing either statistical or modeling work (or both). This often means that I am generating objects in R, such as Analysis of Deviance Tables, that I would like to put into the working document.  This can be an enormous hassle, particularly when your data set is repeatedly updated and the table changes ever so slightly with each iteration of the paper.  It's not such a big deal for small tables, but when there are lots of covariates on the model it is a maddening, time-consuming, hypertensogenic experience.

This has been a particularly acute problem of late as we wind down to the final draft of two big papers with substantial data analysis (and fair sized analysis of deviance tables). I am not joking when I say a solution came to me in a fevered dream.  I'm surprised it hadn't occurred to me before, given past posts on related topics, but what can I say? 

So, here is my basic Kekulé-esque idea: Output the table to a dummy LaTeX document using xtable. After texing, convert the file using LaTeX2rtf.  It's then a simple matter of opening the rtf file in Word.  Copy and paste and voilà tout!  Seems like it works pretty well.  Can anybody think of a less Byzantine way to do this?

New York Times Discovers R

A recent article in the New York Times extolls the virtues of the R statistical programming language.  Better late than never, I suppose.  I first discovered R in 1999, just as I began writing my dissertation. At the time, I used Matlab for all my computational needs.  I still occasionally use Matlab when doing hardcore matrix algebra or numerically solving differential equations.  I also sometimes use Mathematica to check my algebra or to solve equations when I'm feeling lazy (I think there are actually lots more possibilities but exploring these hasn't been a priority), but mostly I now use R. When looking for a post-doc, one of my training goals was learning R. I certainly scored in that department by landing in the Center for Statistics in the Social Sciences at the University of Washington working with Mark Handcock, sharing an office with Steve Goodreau, and interacting with people life Adrian Raftery, Peter Hoff, and Kevin Quinn, I learned a lot about R. I'd like to think that I saw the writing on the wall.  Mostly though, I think I liked the idea of free, open-source, state-of-the-art numerical software.

I use R in many of the classes I teach, including Demography and Life History Theory, Applied Bayesian Methods in the Social Sciences, Data Analysis in the Anthropological Sciences, and our NICHD-funded Workshop in Formal Demography. While I don't expect the students to learn it, I also use R to make most of the figures I show in slides in other classes like Evolutionary Theory, Environmental Change and Emerging Infectious Disease, and even The Evolution of Human Diet. My colleague Ian Robertson also teaches his quantitative classes in R.  Anthropology is also very lucky to have an academic technology specialist, Claudia Engel, with a strong interest in supporting both faculty and student use of R. The Human Spatial Dynamics Laboratory has a growing list of R resources for student (and other's) use.  My lab site will soon host all of our R material for the summer workshops as well as my R package demogR.

I sometimes wonder if other anthropologists are learning R.  I'm sure Steve's students get some R up at UW.  But is there anyone else out there?  Perhaps this is one of the great comparative advantages we can give our students here at Stanford.  Since the New York Times says it's cool, it must be true.

Plotting Recruitment Curves

I was asked how I plotted the recruitment curve from my last post. It's pretty easy to do in R.

[r]
Dn <- expression(r * (1 - N/K) * N) r <- 0.004 K <- 10^10 N <- seq(0,10^10,by=10^7) png(file="recruitment.png") ## sends output to .png file plot(N,eval(Dn),type="l", xlab="Human Population", ylab="Recruitment") dev.off() [/r]

Now we can generalize to the generalized theta logistic model where

 \frac{dN}{dt} = rN(1-N/K)^{\theta}.

This model changes the shape of the density dependence when \theta<1 the density dependence is felt only at higher densities, whereas when \theta>1 the density dependence kicks in at low population size.

Consider our problem of what the optimal harvest size of humans by Kanamits consumers would be if human population size was actually regulated according to the theta-logistic model. First, we assume that \theta<1.

[r]
Dn.gen <- expression((r * (1 - N/K))^theta * N) theta <- 0.1 png(file="recruitment-thless1.png") plot(N,eval(Dn.gen),type="l", xlab="Human Population", ylab="Recruitment") title("theta=0.1") dev.off() [/r]

Now, we assume that \theta>1.

[r]
theta <- 10 png(file="recruitment-thgr1.png") plot(N,eval(Dn.gen),type="l", xlab="Human Population", ylab="Recruitment") title("theta=10") dev.off() [/r]

I sent the output to a portable network graphics (png) device because I wanted to include the figures with this post. Normally, in interactive work, you would send this to the default on-screen device (e.g., x11 or Quartz). When making a figure for publication or to include with a LaTeX document, one would send the output to a pdf device.

From this example, we can see that the shape of the density dependence can pretty drastically change the MSY, at least in the case where the discount rate is zero. When \theta=10, we can see that the Kanamits would only be able to sustainably harvest on the order of a billion people, whereas if \theta=0.1, they could take nearly 9 billion and still have a viable population. I'm guessing that the former is closer to the truth than the latter, but let's hope that the answer remains in the realm of absurdist speculation where it belongs.

Nearly Neutral Networks and Holey Adaptive Landscapes

My holiday reading on modularity has led me into some of the literature on the evolution of complexity.  Some of the most interesting work in theoretical biology that I've read in a while relates to the ideas of nearly neutral networks and holey adaptive landscapes, an area developed by Sergey Gavrilets at the University of Tennessee.  The various papers of his to which I refer can be accessed on his website.  I find his explanations very clear, but recognize that this work is fairly technical stuff and my understanding of it is greatly facilitated by previous experience with similar models in the context of epidemics on networks (believe it or not). Nonetheless, a reasonably accessible introduction can be found in his 2003 chapter, "Evolution and speciation in a hyperspace: the roles of neutrality, selection, mutation and random drift." I have based much of my discussion here on this paper along with his 1997 paper in JTB.

The father of American population genetics and Modern Evolutionary Synthesis pioneer Sewall Wright first came up with the metaphor of the adaptive landscape in 1932.  The basic idea is a kind of topographic map where the map coordinates are given by the genotype and the heights above these coordinates are given by the fitnesses associated with particular genotype combinations.  A landscape, of course, is a three dimensional object.  It has a length, a width (or latitude and longitude) and height.  This particular dimensionality turns out to be very important for this story.

A major concern that arises from the idea of an adaptive landscape is how populations get from one peak to another.  In order to do this, they need to pass through a valley of low fitness and this runs rather counter to our intuitions of the way natural selection works.  The usual way around this apparent paradox is to postulate that populations are small and that random genetic drift (which will be more severely felt in small populations) moves the population away from its optimal point on the landscape.  Once perturbed down into a valley by random forces, there is the possibility that the population can climb some other adaptive peak.

This is a slightly unsatisfying explanation though.  Say that we have a finite population of a diploid organism characterized by a single diallelic locus. Finite populations are subject to random drift. The size of the population is N.  Assume that the fitnesses are w_{AA}=1, w_{Aa}=1-s, and w_{aa}=1. This is actually a very simple one-dimensional adaptive landscape with peaks at the ends of the segment and a valley in between.  Assume that the resident population is all AA.  What happens to a mutant a allele? We know from population genetics theory that the probability that a completely neutral (i.e., s=0) mutant allele reaching fixation is 1/2N.  Russ Lande has shown that when the s>0 this probability becomes:

 U = \frac{1}{2N} \frac{e^{-Ns}\sqrt{4Ns/\pi}}{erf(\sqrt{Ns})},

where erf() is the error function  erf(t) = 2/\sqrt{\pi} \int_0^t e^{-y^2} dy.

When Ns=20 (say a population size of 200 and a fitness penalty of s=0.1), this probability is approximately U=10^{-8}.  So for quite modest population size and fitness disadvantage for the heterozygote, the probability that the population will drift from AA to aa is very small.  This would seem to spell trouble for the adaptive landscape model.

Gavrilets solved this conundrum -- that moving between peaks on the adaptive landscape appears to require the repeated traversing of very low-probability events -- apparently by thinking a little harder about the Wrightean metaphor than the rest of us.  Our brains can visualize things very well in three dimensions.  Above that, we lose that ability.  Despite all the Punnett squares we may have done in high school biology, real genotypes, of course, are not 2 or 3 dimensional.  Instead, even the simplest organism has a genotype space defined by thousands of dimensions.  What does a thousand dimensional landscape look like? I haven't the faintest idea and I seriously doubt anyone else does either.  Really, all our intuitions about the geometry of such spaces very rapidly disappear when we go beyond three dimensions. 

Using percolation theory from condensed matter physics, Gavrilets reveals a highly counter-intuitive feature of such spaces' topology. In particular, there are paths through this space that are very nearly neutral with respect to fitness.  This path is what is termed a "nearly neutral network." This means that a population can drift around genotype space moving closer to particular configurations (of different fitness) while nonetheless maintaining the same fitness.  It seems that the apparent problem of getting from one fitness peak to another in the adaptive landscape is actually an artifact of using low-dimensional models. In high-dimensional space, it turns out there are short-cuts between fitness peaks.  Fitness wormholes?  Maybe.

Gavrilets and Gravner (1997) provide an example of a nearly neutral network with a very simple example motivated by Dobzhansky (1937).  This model makes it easier to imagine what they mean by nearly neutral networks in more realistic genotype spaces.

Assume that fitness takes on one of two binary values: viable and non-viable. This assumption turns our space into a particularly easy type of structure with which to work (and it turns out, it is easy to relax this assumption).  Say that we have a three diallelic loci (A, B, and C).  Say also that we have reproductively isolated "species" whenever there is a difference of two homozygous loci -- i.e., in order to be a species a genotype must differ from the others by at least homozygous loci.  The reproductive isolation that defines these species is enforced by the fact that individuals heterozygous at more than one locus are non-viable. While it may be a little hard to think of this as a "landscape", it is.  The species nodes on the cube are the peaks of the landscape.  The valleys that separate them are the non-viable nodes on the cube face.  Our model for this is a cube depicted in this figure.

Now using only the visible faces of our projected cube, I highlight the different species in blue.

The cool thing about this landscape is that there are actually ridges that connect our peaks and it is along these ridges that evolution can proceed without us needing to postulate special conditions like small population size, etc. The paths between species are represented by the purple nodes of the cube.  All the nodes that remain black are non-viable so that an evolutionary sequence leading from one species to another can not pass through them.  We can see that there is a modest path that leads from one species to another -- i.e., from peak to peak of the fitness landscape. Note that we can not traverse the faces (representing heterozygotes for two loci) but have to stick to edges of the cube -- the ridges of our fitness landscape.  There are 27 nodes on our cube and it turns out that 11 of them are viable (though the figure only shows the ones visible in our 2d projection of the cube).

So much for a three-dimensional genotype space. This is where the percolation theory comes in. Gavrilets and Gravner (1997) show that as we increase the dimensionality, the probability that we get a large path connecting different genotypes with identical fitness increases.  Say that the assignment of fitness associated with a genotype is random with probability p that the genotype is viable and 1-p that it is non-viable.  When p is small, it means that the environment is particularly harsh and that very few genotype combinations are going to be viable. In general, we expect p to be small since most random genotype combinations will be non-viable. Percolation theory shows that there are essentially two regimes in our space.  When p<p_c, where p_c is a critical threshold probability, the system is subcritical and we will have many small paths in the space.  When  p>p_c, we achieve criticality and a giant component forms, making a large viable evolutionary path  traversing many different genotypes in the space.  These super-critical landscapes are what Gavrilets calls "holey". Returning to our three dimensional cube, imagine that it is a chunk of Swiss cheese.  If we were to slice a face off, there would be connected parts (i.e., the cheese) and holes.  If we were, say, ants trying to get across this slice of cheese, we would stick to the contiguous cheese and avoid the holes. As we increase the dimensionality of our cheese, the holes take up less and less of our slices (this might be pushing the metaphor too far, but hopefully it makes some sense).

A holey adaptive landscape holds a great deal of potential for evolutionary change via the fixation of single mutations.  From any given point in the genotype space, there are many possibilities for evolutionary change.  In contrast, when the system is sub-critical, there are typically only a couple of possible changes from any particular point in genotype space.

To get a sense for sub-critical and supercritical networks, I have simulated some random graphs (in the graph theoretic sense) using Carter Butts's sna package for R.  These are simple 1000-node Bernoulli graphs (i.e., there is a constant probability that two nodes in the graph will share an undirected edge connecting them).  In the first one, the probability that two nodes share an edge is below the critical threshold p_c.


We see that there are a variety of short paths throughout the graph space but that starting from any random point in the space, there are not a lot of viable options along which evolution can proceed. In contrast to the sub-critical case, the next figure shows a similar 1000-node Bernoulli graph with the tie probability above the critical threshold -- the so-called "percolation threshold."

Here we see the coalescence of a giant component.  For this particular simulated network, the giant component contains 59.4% of the graph.  In contrast, the largest connected component in the sub-critical graph contained 1% of the nodes.  The biological interpretation of this graph is that there are many viable pathways along which evolution can proceed from many different parts of the genotype space. Large portions of the space can be traversed without having to pass through valleys in the fitness landscape.

This work all relates to the concept of evolvability, discussed in the excellent (2008) essay by Massimo Pigliucci.  Holey adaptive landscapes make evolvability possible.  The ability to move genotypes around large stretches of the possible genotype space without having to repeatedly pull off highly improbable events means that adaptive evolution is not only possible, it is likely.  In an interesting twist, this new understanding of the evolutionary process provided by Gavrilets's work increases the role of random genetic drift in adaptive evolution.  Drift pushes populations around along the neutral networks, placing them closer to alternative adaptive peaks that might be attainable with a shift in selection.

Super cool stuff.  Will it actually aid my research?  That's another question altogether...

Another fun thing about this work is that this is essentially the same formalism that Mark Handcock and I used in our paper on epidemic thresholds in two-sex network models. I never cease being amazed at the utility of graph theory.

References

Dobzhansky, T. 1937. Genetics and the Origin of Species. New York: Columbia University Press.

Gavrilets, S. 2003. Evolution and speciation in a hyperspace: the roles of neutrality, selection, mutation and random drift. In Crutchfield, J. and P. Schuster (eds.) Towards a Comprehensive Dynamics of Evolution - Exploring the Interplay of Selection, Neutrality, Accident, and Function. Oxford University Press. pp.135-162.

Gavrilets, S., and J.Gravner. 1979. Percolation on the fitness hypercube and the evolution of reproductive isolation. Journal of Theoretical Biology 184: 51-64.

Lande, R.A. 1979. Effective Deme Sizes During Long-Term Evolution Estimated from Rates of Chromosomal Rearrangement. Evolution 33 (1):234-251.

Pigliucci, M. 2008. Is Evolvability Evolvable? Nature Genetics 9:75-82.

Wright, S. 1932. The roles of mutation, inbreeding, crossbreeding and selection in evolution. Proceedings of the 6th International Congress of Genetics. 1: 356–366.


Plotting Networks in R

Using the network package, you can plot graphs in a flexible and powerful way.  Often, when plotting a network, we want to vary the color, size, or shape of the vertices based on some attributes.  Let's say that we have a freewheeling sexual network (easier to simulate) and we would like to color the vertices of the graph according to their HIV sero-status.  Let's also say that we want to make the shape of each vertex reflect the sex of the individual.  We use the following code:

[r]
# begin with randomly constructed edgelist
set.seed(12345)

n1 <- round(1+10*runif(50)) n2 <- round(1+10*runif(50)) eee <- cbind(n1,n2)[order(n1),] net <- network(eee,directed=FALSE) # this will be a dense network! hiv <- rbinom(50,size=1,prob=0.2) # random infections! sex <- rbinom(50,size=1,prob=0.5) # random sexes! set.vertex.attribute(net,"hiv",hiv+1) set.vertex.attribute(net,"sex",sex+3) ## now plot plot(net, vertex.col="hiv", vertex.sides="sex", vertex.cex=5, vertex.rot=-30, edge.lwd=1) [/r] I definitely wouldn't want to be part of that party.

Arrgh...

I never did get around to writing about International Talk Like a Pirate Day yesterday.  Carl Boe, from Berkeley, and I have a long-running joke about pirate-speak stemming from our teaching computing for formal demography using that old swashbuckler standby software -- you guessed it -- R.  We wanted to reduce the anxiety generated in students who needed to simultaneously learn both the methods of formal demography and steep-learning-curve software by dressing -- and talking -- as pirates.  We never did do it, but there are always future workshops.  This year, Carl sent me the following amusing picture related to Talk Like a Pirate Day.

Pirate Keyboard