So there I was. 23 hundred hours, New Year's Eve 2008 at my in-laws' in Corvallis, Oregon. Kids asleep in the other room. Spouse headed in the same direction. Insomniac from lack of activity and feelings of general physical displacement. Not much prospect for a party or other New Year's antics. Sounds like the perfect set-up for a Twilight Zone marathon, no? I think that I managed to make it through about 8 episodes in the wee hours of the first day of 2009. I wonder what that augers for the new year?
One of the episodes I managed to watch was "To Serve Man" (viewable freely in its entirety here). It's your standard aliens land, aliens altruistically transfer advanced technology, aliens solve all of humanity's problems, aliens turn out to have ulterior motives, aliens plan to eat all of humanity kind of plots. You see, the Kanamits have come to Earth to bring humanity back to their home world to eat them. The book that the Kanamits spokesman leaves in the United Nations (the big tease...) turns out to be a cookbook, a fact that the crack cryptographic team headed by protagonist Michael Chambers discovers too late. Chambers is already boarding the ship bound for his vacation getaway to the Kanamits' home world when the real brains of his outfit, the beautiful Pat, comes running to inform him (and, maddeningly for humanity, only him) of the horrible news. He's shipping off to get eaten. Get it? "Serve" as in provide assistance vs. "serve" as in provide a meal?
Toward the end of the episode, Michael Chambers, says in soliloquy that the recollections he has just shared represent the life cycle of Man "from dust to dessert." He comments that every person will ultimately share his fate (i.e., being served): "Sooner or later, we'll all of us be on the menu." This is what got me. Surely not. This doesn't seem like very good natural resource management on the part of the Kanamits.
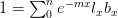
The classical theory of natural resource management suggests that there should be a maximally sustainable yield for farmed humans. We will assume that human population growth can be written in terms of its current size and some function of size  , where
  indicates the derivative of population size with respect to time
  . For simplicity's sake, let's assume that the effect of density on the human growth rate is linear such that
 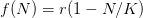 , where
  is the intrinsic rate of natural increase
  is the carrying capacity (i.e., the maximum number of people the Earth could potentially support).
Now, I should note that this is a purely hypothetical exercise meant simply to illustrate basic concepts. In any real Soylent Green like future where we are faced with fattening Peter to save Paul, we would need a much more sophisticated population model. Among other things, the idea of a carrying capacity for humanity is a maddeningly elusive one. The eminent demographer Joel Cohen has written a whole book on the matter and comes up with no particularly satisfying answer to the seemingly basic question of How Many People Can The Earth Support?
For argument's sake, let's just say that the maximum intrinsic rate of increase is  (4% annual growth, which is high, but remember, humanity has just received this remarkable technology transfer) and the carrying capacity is
  (i.e., 10 billion). Population growth changes with population size. We can plot the incremental increase (recruitment) as a function of population size. The maximum point of this so-called recruitment curve, where
  is the MSY.

For the simple linear model of density-dependence (i.e., the logistic growth equation) and with no time preferences on the part of the Kanamits, the maximum sustainable yield (MSY) occurs at  or 5 billion souls. So, you can now understand my dismay at 0200 (or whatever it was) on the first day of 2009. Why would everyone necessarily meet the fate of Michael Chambers? Under optimal harvest management, only half should be harvested. I can think of at least three explanations for this conundrum:
- Michael Chambers is either misinformed (he was a cryptographer, after all, and not a wildlife manager) or was exaggerating for dramatic effect.
- The Kanamits, while advanced in the physical sciences, had not developed an adequate theory of natural resource management or population dynamics more generally. Perhaps this is why they needed to come all the way to Earth to acquire their dessert?
- Perhaps the Kanamits actually had a very sophisticated understanding of population biology and realized that the human intrinsic rate of increase was less than the prevailing discount rate. Under these conditions, the optimal resource-management strategy is liquidation of the stock.
I'm leaning toward explanation #3. That was an awful long way to come, after all.
Sobering thoughts with which to commence the new year.

 logistic model where
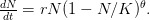
 the density dependence is felt only at higher densities, whereas when
  the density dependence kicks in at low population size.

 document, one would send the output to a pdf device.
 , we can see that the Kanamits would only be able to sustainably harvest on the order of a billion people, whereas if
  , they could take nearly 9 billion and still have a viable population. I'm guessing that the former is closer to the truth than the latter, but let's hope that the answer remains in the realm of absurdist speculation where it belongs.