Tag Archives: epidemic curve

Trailing Off of the Epidemic Curve?

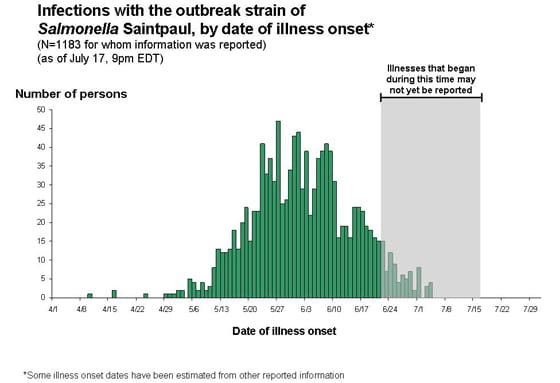
The latest CDC report on the ongoing Salmonella serotype Saintpaul suggests that we may indeed be nearing the end.  Here is the epidemic curve as of 28 July:

28 July Salmonella Epidemic Curve

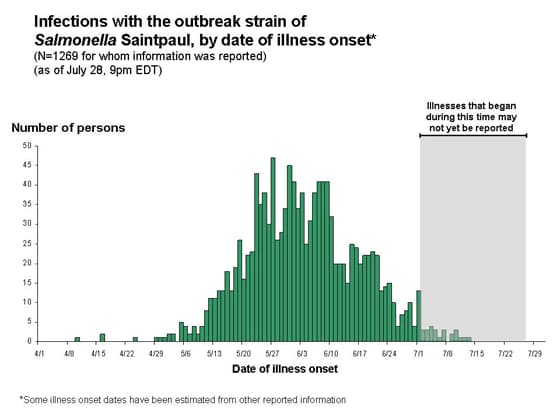
While there is certainly still the possibility of more cases appearing that have not yet been reported or another introduction (see previous post), the fact that the epidemic curve has continued to trail off in two successive weeks is good news.

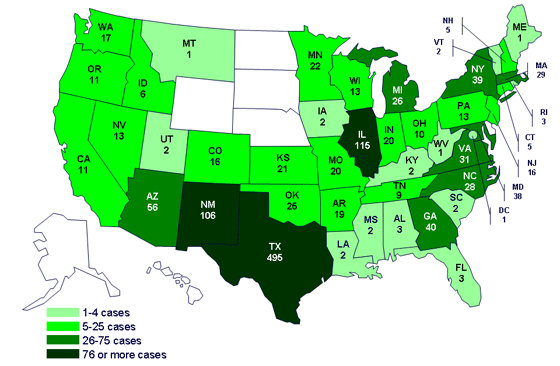
The epidemiological evidence continues to implicate fresh jalapeño chiles grown in México.  As of 28 July, 1307 cases have been reported since 1 April 2008. Nearly every state in the union has reported at least one case from this outbreak, as can be seen on this map:

CDC Map of Salmonella Cases 07/28/08

Again the most likely victims (at least to report illness) are 20-29 year-old adults while the least likely to report illness are 10-19 year-olds and those over 80.  Once again, I suggest that this is consistent with a vehicle consumed along with alcoholic beverages. Salsa.  Though contaminated jalapeños (or other produce) could, of course, make their way into other foods as well. The Saintpaul strain was relatively rare before this outbreak, leading CDC to suggest the following:

The previous rarity of this strain and the distribution of illnesses in all U.S. regions suggest that the implicated food is distributed throughout much of the country. Because many persons with Salmonella illness do not have a stool specimen tested, it is likely that many more illnesses have occurred than those reported. 

Let's hope that this outbreak is really coming to an end.  It would be nice if we could identify the source of the infection.  Foodborne disease is an important public health concern that probably does not receive the attention it should.  A 1999 paper by Mead and colleagues (admittedly now a bit long in the tooth) estimated that foodborne diseases cause approximately 76 million illnesses, 325,000 hospitalizations, and 5,000 deaths in the United States each year.  It is not hard to imagine that in the 10 years since this study the foodborne disease burden has increased in the U.S.  Time for another study, I'd say.

Update on Salmonellosis Saintpaul

The Centers for Disease Control and Prevention have just issued a new report on the ongoing outbreak of Salmonella serotype Saintpaul infection. Since April, 1237 people have been infected.  The investigation has continued to focus on raw tomatoes but also jalepeño (and serrano) chiles and cilantro.  This further supports my previous speculation, based on the age profile of the cases, that salsa consumed while drinking alcoholic beverages might be implicated in this outbreak.  Epidemiological investigations are greatly complicated when multiple vehicles that are typically consumed together are implicated.

There is an interesting caution that accompanies the epidemic curve:

Salmonellosis Saintpaul Epidemic Curve

This has to do with the fact that it can be very misleading to read too much into an epidemic curve for an ongoing outbreak. Consider the epidemic curve for the 2003 SARS outbreak in Singapore:

Singapore 2003 SARS Epidemic Curve

Now imagine we were looking at the curve as it evolved on 12 March.  We might have be tempted to say that the epidemic was coming to an end and, man, would we ever have been wrong! There are a couple of things at work here.  First, epidemics often have multiple introductions and while theory tells us that an epidemic curve will be more or less bell shaped, this is based on the assumption of a single introduction.  If you look at the SARS epidemic curve hard enough, you can see several more-or-less bell-shaped components added together.  The second issue with SARS is that there is extreme heterogeneity in transmission.  Patient #1 probably infected 21 other cases, patient #4 probably infected 62.  The great majority of others infected none.  Individuals who infect more than 10 others are what is known as "superspreaders."  There were five in the Singapore outbreak out of a total of 201 probable cases of SARS and 722 suspect cases.  Finally, there is often a delay between when people get sick and when their cases are reported.  This means that the trailing edge of the epidemic curve always looks like it's closing off its bell shape. The full case report for the Singapore outbreak can be found here

So, is the current Salmonellosis outbreak on the wane?  Let's hope so, but as CDC warns:

It can be difficult to say when the outbreak is over, because of the reporting delay.   The delay means that the curve for the most recent three weeks always looks like the outbreak could be ending even during an active outbreak. The full shape of the curve is only clear after the outbreak is over.

With a vehicle-borne disease, we don't have to worry about superspreaders, but the fact that we still don't know the source of the infection or the ultimate cause of the contamination is troubling.  Who knows how much contaminated (presumably) produce is lurking out there?  I, for one, will make sure to wash my produce well!