The first produce to positively match the Salmonella serotype Saintpaul was announced today. A jalapeño chile, grown in México and processed at an unnamed plant in McAllen, Texas, tested positive for the strain of Salmonella that has sickened at least 1237 people since April. This is the first time that the bug has actually shown up on a sample of fresh produce. Perhaps it wasn't tomatoes after all, but it is a nice demonstration of confounding in epidemiological inference (tomatoes and jalapeños are commonly served together in the form of salsa, making it difficult to determine which is the actual vehicle for infection if both are implicated). Now the question is where along the production chain the contamination took place and how we can make sure that we bring an end to this outbreak. All of the news stories and government reports on this topic can be found on the ProMedMail website.
Category Archives: Statistics
Update on Salmonellosis Saintpaul
The Centers for Disease Control and Prevention have just issued a new report on the ongoing outbreak of Salmonella serotype Saintpaul infection. Since April, 1237 people have been infected. The investigation has continued to focus on raw tomatoes but also jalepeño (and serrano) chiles and cilantro. This further supports my previous speculation, based on the age profile of the cases, that salsa consumed while drinking alcoholic beverages might be implicated in this outbreak. Epidemiological investigations are greatly complicated when multiple vehicles that are typically consumed together are implicated.
There is an interesting caution that accompanies the epidemic curve:
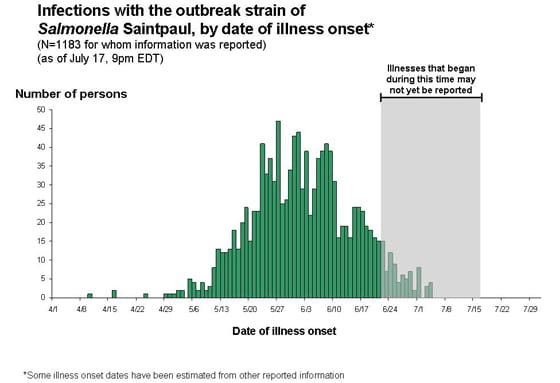
This has to do with the fact that it can be very misleading to read too much into an epidemic curve for an ongoing outbreak. Consider the epidemic curve for the 2003 SARS outbreak in Singapore:

Now imagine we were looking at the curve as it evolved on 12 March. We might have be tempted to say that the epidemic was coming to an end and, man, would we ever have been wrong! There are a couple of things at work here. First, epidemics often have multiple introductions and while theory tells us that an epidemic curve will be more or less bell shaped, this is based on the assumption of a single introduction. If you look at the SARS epidemic curve hard enough, you can see several more-or-less bell-shaped components added together. The second issue with SARS is that there is extreme heterogeneity in transmission. Patient #1 probably infected 21 other cases, patient #4 probably infected 62. The great majority of others infected none. Individuals who infect more than 10 others are what is known as "superspreaders." There were five in the Singapore outbreak out of a total of 201 probable cases of SARS and 722 suspect cases. Finally, there is often a delay between when people get sick and when their cases are reported. This means that the trailing edge of the epidemic curve always looks like it's closing off its bell shape. The full case report for the Singapore outbreak can be found here.
So, is the current Salmonellosis outbreak on the wane? Let's hope so, but as CDC warns:
It can be difficult to say when the outbreak is over, because of the reporting delay. The delay means that the curve for the most recent three weeks always looks like the outbreak could be ending even during an active outbreak. The full shape of the curve is only clear after the outbreak is over.
With a vehicle-borne disease, we don't have to worry about superspreaders, but the fact that we still don't know the source of the infection or the ultimate cause of the contamination is troubling. Who knows how much contaminated (presumably) produce is lurking out there? I, for one, will make sure to wash my produce well!
Statistical Models
OK, this is just good nerdy fun.
Phantom Co-Author
It's always nice to have one's work written up in Science. It would be even nicer to be named as a co-author in the write-up. I suppose being the stats guy in a multi-author collaboration is kind of like being the drummer in a rock band...
Ugh, Here It Is Again
One of my favorite shows, Wait Wait... Don't Tell Me, today cited the ridiculous evolutionary psychology result that I discussed which was based on bogus curve-fitting. I guess it's reified now...
Do These Points Form a Curve?
I was interested to browse through a paper by Buunk et al. in the most recent issue of Evolution and Human Behavior in which the authors report the results of psychological experiments exploring the differential relationship between height and sexual jealousy in women and men. The authors predicted that (self-reported) sexual jealousy would decline with increasing height in men and that women of average height would report the lowest levels of sexual jealousy. The theory driving these predictions is that higher-status, more attractive individuals should be less jealous on average because they are better able to prevail over would-be competitors and, presumably, if they experience partner infidelity, they can always find another partner. The authors cite the abundant evidence for increased social dominance in taller men and suggest the relationship between women's attractiveness and height is quadratic, with women of average height being most attractive. One hundred women and 100 men were asked question, “In general, how jealous are you in your current relationship?” Responses fell on a six point scale ranging from (1) "not jealous" to (6) "morbidly jealous". The authors' results apparently support their hypotheses. So here are the two figures that they use to show that (1) jealously declines linearly with height in men and (2) is quadratic for women, with average-height women least jealous. The first figure is for men:

The second figure is for women:

Hmmm. I don't know if I would rest much on the interpretation of that figure as being "quadratic." It seems entirely possible that the curve is driven simply by the sparseness of the tails. There are fewer women of extreme height, either tall or short and this allows a few influential points to leverage the line up at the ends. Think about the upper 95% confidence interval of a linear regression line. Doesn't look that different from their figure 2, no? This makes me wonder how robust the relationship is. For example, if we were to bootstrap replicate samples (with replacement) and re-fit the quadratic form, how many would have a significant at some conventional level (e.g., p<0.05)? There is also the question of whether this quadratic curve fits better than a linear relationship. One could test the two nested models using a likelihood ratio test.
Then there is the question of confounding variables. At the very least, it seems that one would want to control for age of the actors, duration of relationship, and quite possibly other measures of wealth or status. It seems reasonable to posit that being extremely wealthy would modify the degree of sexual jealousy experienced by a man of average height, for instance.
This is why I remain a skeptic of evolutionary psychology...
Reference
Buunk, A.P. J. H. Park, R. Zurriaga, L. Klavina and K. Massar (2008) Height predicts jealousy differently for men and women. Evolution and Human Behavior. 29(2):133-139.